 Most traders are familiar with the concept of support and resistance.
Some of the most common trading patterns are based around the idea of trading breakouts of support and resistance or trading ranges between the two levels.
Today I wanted to add an extra element into your understanding of support and resistance and how it can help your trading.
Market profile (or volume profile) is a tool we can use to show how much volume has traded at a given price.
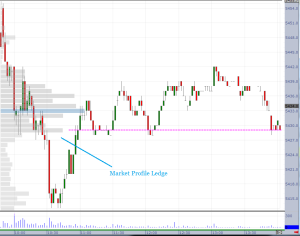
Looking at the chart I have above we can see how it shows up like a graph with the longer bars showing more volume and the smaller bars showing less.
Now I want you to take a look at the level I have highlighted in pink.
There is quite a difference between the two bars at 5428 and 5429.
What’s this telling us.
Well it’s saying that there is a lot of buying taking place at 5429 and not so much at 5428. If there’s buying going on there then that’s really what I would consider to be “support”.
You can also see on the chart that price came down and tested that level a number of times throughout the day.
It was a good place to look to get long.
Most people look at their charts and see only what it’s telling us on the surface.
But if you look beneath the surface, with a tool like market profile, then you can start seeing what’s really going on.
Good Trading