Short term trading is all about identifying areas where there is a buyer or a seller. That’s what moves markets.
In trading we all love charts. There’s something inherently satisfying about drawing patterns on charts, whether that’s a trendline or a moving average or whatever.
As a short term trader I always felt that following chart patterns was a great way to miss the move. A good example of that is candlestick patterns.
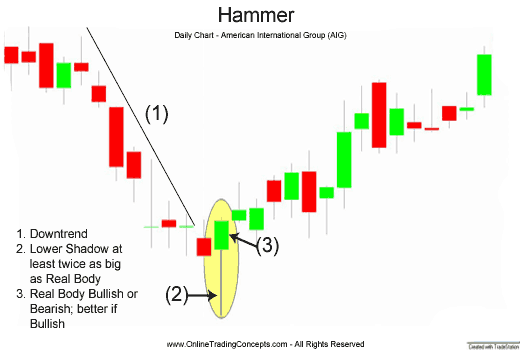
They look great but in reality the bulk of the move has already happened. Take a hammer trading pattern for example. On a chart it might look something like this.
Conventional wisdom suggest that you should buy at the close of the hammer or the open of the next bar. Note the above chart is daily but just imagine that it’s a one minute chart.
Looking at the chart the reality is that the buyer was active right down the bottom of the candle. If you’re using this pattern as an entry you are getting in right at the point when you should be exiting the trade.
If you were using the orderbook, you would have seen that there was a buyer right down at the bottom (the wick if you like) who wanted to buy and buy right now!
Effectively you’re risking a lot less to ride the potential wave of buying, by using the DOM for your entries.
So next time you see a pattern like this on a short term chart – think to yourself that you’ve most likely missed the move already.

Leave a Reply