I’m back with week 2 of my month long Futures Trading Bootcamp.
You can find my week 1 post here.
Hopefully you’ve been able to start conditioning your eyes and you are starting to see the way in which orders are executed using the orderbook. It’s not an easy process as I’ve said before and the learning curve is steep. However the rewards will certainly be there if you can stick it out.
So now onto this weeks exercise and it’s one that builds on last week.
I want to again take you back to thinking about what a large trader might do when they execute an order. Theoretically, we said that if you had a large number of contracts to execute you’d likely do it slowly and try to disguise what you were doing.
So what if there was another tool we could use to identify a place where there is likely to be a large amount of buying and selling going on.
Enter our next tool – Volume Profile.
Week 2

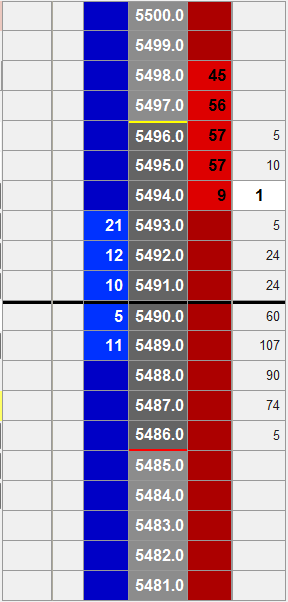
Now if you look on our DOM in the image we can see the volume profile on the very right had side. It is showing the cumulative contracts that have traded in that session. Last week we were mostly focused on the contracts that had just been trading recently. Volume profile is really just the total of all those trades.
So why is that useful to us? Well it’s really showing us where there has been a large amount of buying and selling that have been going on at a given level. And if there has been a lot of volume at a given price level previously, then there is a fair chance that there will be more action next time around when we get back to that level.
But how do we identify the levels of interest?
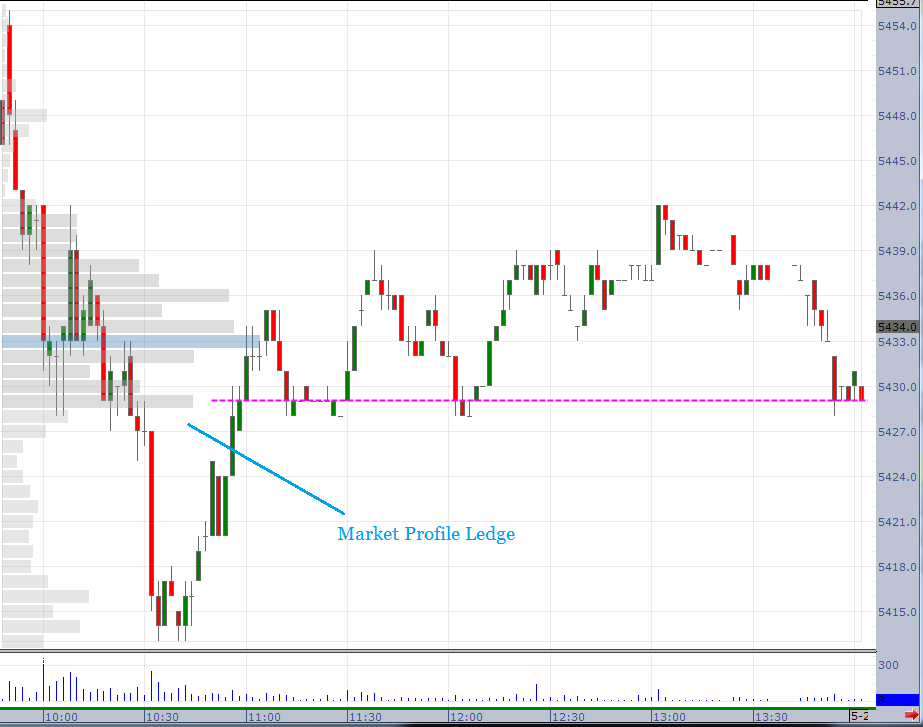
I like to look for what I call a volume profile ledge.
It’s a ledge in the sense that there is a significant difference between two price levels. So at one level (tick) below, there is perhaps only a small amount of contracts that have traded and at the level above or below (depending on the direction) there are a lot.
You can see the volume profile either as a number on the DOM, or you can actually bring it up on a chart. For the point of this article I’ll show you on a chart so it is a bit clearer. Note there is also a mini histogram you can bring up on the XTrader DOM too.

As you can see, on the chart there is a significant difference between the number of contracts traded at 5429 and 5428. Now the actual number of contracts aren’t all that important. What is important is that there is a significant difference between the two levels.
So imagine once again what has been going on here.
What we are seeing is that every time price has traded back down to these levels, a buyer has stepped in and started buying.
Does that sound like a familiar concept?
To me that is the definition of support. However I would suggest that this is a far more accurate idea of what support is than simply drawing lines on charts.
So how can we use this support level – our volume profile ledge – to help improve our DOM trading?
Well we can incorporate our ability to spot the buying and selling that we learnt last week, with these significant volume profile levels.
Exercise
Watch the DOM in the opening 2 hours of trading on your chosen market as you did in week 1.
As the session progresses, the volume profile areas will slowly start to develop.
Look for price levels that have significantly higher volume. Ideally there would be a ledge in place, but if not focus on the high volume levels. When price starts trading at these high volume levels and there is 3-4 times the size of the bid or offer trading (as we did in week 1), enter a limit order and try and get filled.
Hold the trade until it goes in your favour and exit when 3-4 times the size of the bid or offer trade in the opposite direction.
If the trade goes against you by 3-4 ticks exit and look for the next trade.
Bonus Points
As you become more comfortable identifying the high volume areas start making a note of how price begins to react in specific areas.
What happens when the volume ledge is close to the high or the low of the day? What happens when it’s a long way away?
What happens if there is a volume ledge but price has been trading in a very small range compared to a wide range?
What happens when price trades at the highest volume level – also know as the high volume node?
What happens when price meets a volume ledge early in the session compared to later?
These are questions that you can start to ask yourself and will be important going forward. You’ll quickly start seeing patterns so I suggest you start making a few notes in a notebook or with Word. This will be helpful in week 4.
As ever please leave a comment if I haven’t been clear enough with what you need to do and I’m more than happy to help.
I’ll be back soon with the next exercise which will again build on this one.
Good luck.
Hi,
Article precise and well explained.
The volume profile is important for the trading.
Observe how the price reacts to the approach of HVN. And when it crosses the HVN … the game is changing
Cheers
Domy
Thanks Domy.
You are spot on, the HVN is a very interesting point to watch and hopefully some of the newer DOM traders can pick up on how it trades in those areas.
Cheers
VAP is very important, in that the fish are at the edges, and the sharks are in the middle, you would be chopped up in the middle of a balanced, or value range. I could not agreee more with this post, and I have done extensive work studying VAP. Here are 2 videos of the same session. First showing Ledges on the DOM, and second showing what happens to cumlative size showing and the effects as price reflects the emotions and fear that traders encounter after size on the ladder. I only use the DOM, not charts, the charts is illustrated for structure only.
https://www.youtube.com/watch?v=JDmS2Lfeatg
Bid/Ask small = 250+ contracts total on that price in that timeframe.
Bid/Ask medium 500+
Bid/Ask Large 750+
This video is large size on cumulative size and effects on price.
https://www.youtube.com/watch?v=R67e8Ws8VYE
My post should viewed in harmony with the main post.